Product
The field won't warn you. Grape will.
By Grape.ag
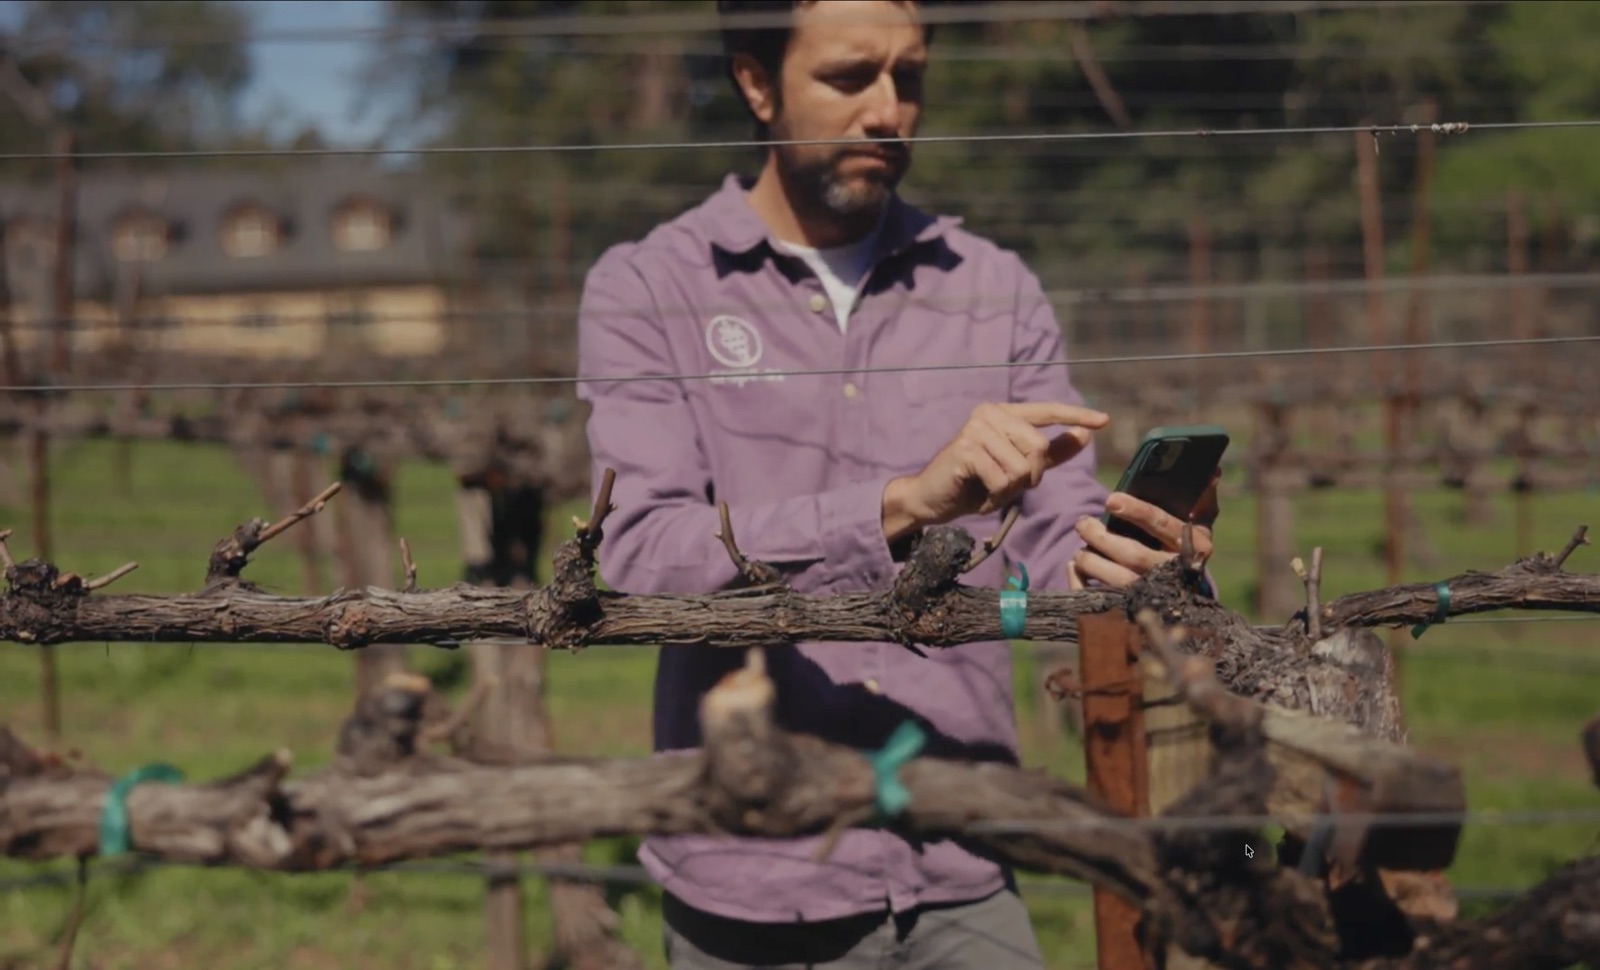
Every grower knows the feeling: you find out about the problem once it’s already visible. The frost that burned the shoots. The powdery mildew outbreak that spread. The irrigation that ran long. By then, the season has already sent you the bill.
Grape exists to reverse that order: know sooner, decide in time.
“I don’t know what’s happening in my field right now”
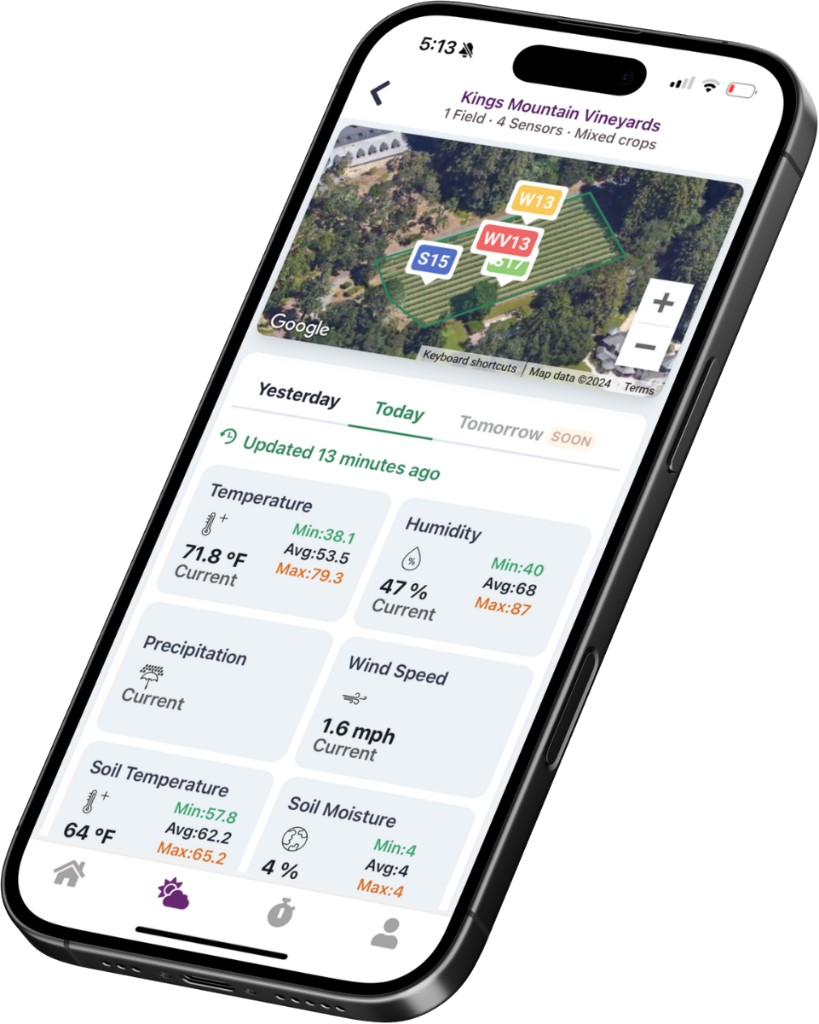
Grape’s sensors measure the actual microclimate of your fields — not the nearest weather station miles away — and hand it to you in a clear summary: minimum and maximum temperature, humidity, rainfall and wind. At a glance you know how yesterday behaved, how today is going and what tomorrow holds.
“I hear about frost and rain after they’ve happened”
Our forecasting algorithm for temperature, humidity and rainfall gives you room to act. And with configurable alerts, the platform comes looking for you: you set your critical ranges and get the warning when something goes out of bounds, even if you’re not watching the app.
“I have data, but I don’t know what to do with it”
A number on its own doesn’t make decisions. That’s why Grape calculates the indices you actually use in the field: powdery mildew risk, growing degree days, hours per temperature range, evapotranspiration and vapor pressure deficit. You stop reading tables and start knowing your fields deeper.
“I irrigate by calendar, not by need”
Connect your flow sensors and keep a record of every irrigation session: how much, when and where. Add soil moisture — even at multiple depths, so you can see how water moves down the row — plus evapotranspiration, and irrigate on data, not on habit.
“Field notes get lost between notebooks and group chats”
The digital logbook brings it all together in one place: observations with photos, voice notes recorded right there in the field, and tasks you assign to your team and follow on a calendar or a board. You also record phenological stages block by block, so each block’s history doesn’t depend on anyone’s memory.
“Putting the report together takes me half a week”
With Reports Gallery you generate reports from your microclimate data in minutes, with charts, tables and comparisons ready to share with your team or your client.
And Baco, your analysis assistant, is there for the rest: ask it about your data, request a chart or a specific analysis, and it answers in seconds.
All of this in Spanish or English, in metric or imperial units, organized by fields and ranches, and available on both the dashboard and the mobile app — because many decisions get made standing in the field.
Your instincts. Your experience. Your data—making every decision more precise.